Core thesis
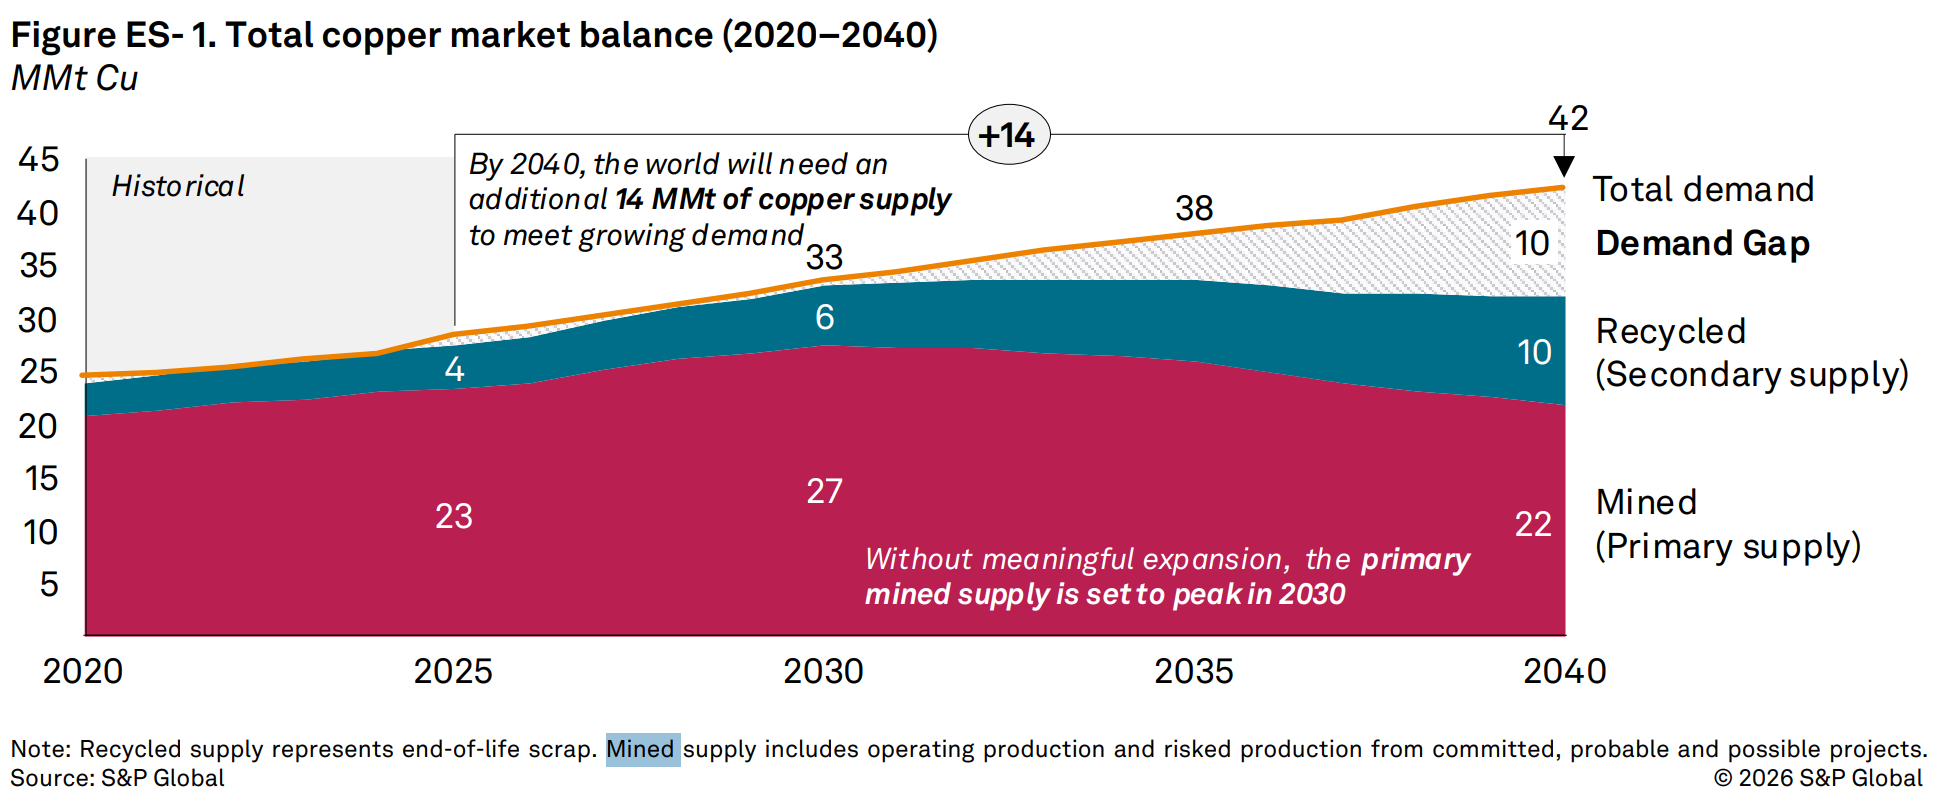
- Before 2025, refined and recycled copper supply and demand were roughly 27–28 million tonnes: about 23.5 Mt of mined copper and 4 Mt of recycled copper.
- By 2030, both supply and demand are projected near 33 Mt. Mined supply is expected to peak around then, creating deficits afterward.
- S&P’s current forecasts still assume linear growth in copper demand from grids and AI data centers; actual growth could materially exceed them.
Primary source for the charts and forecasts: S&P Global, Copper in the Age of AI: Challenges of Electrification, January 2026.
S&P copper supply and demand
Sources of incremental demand
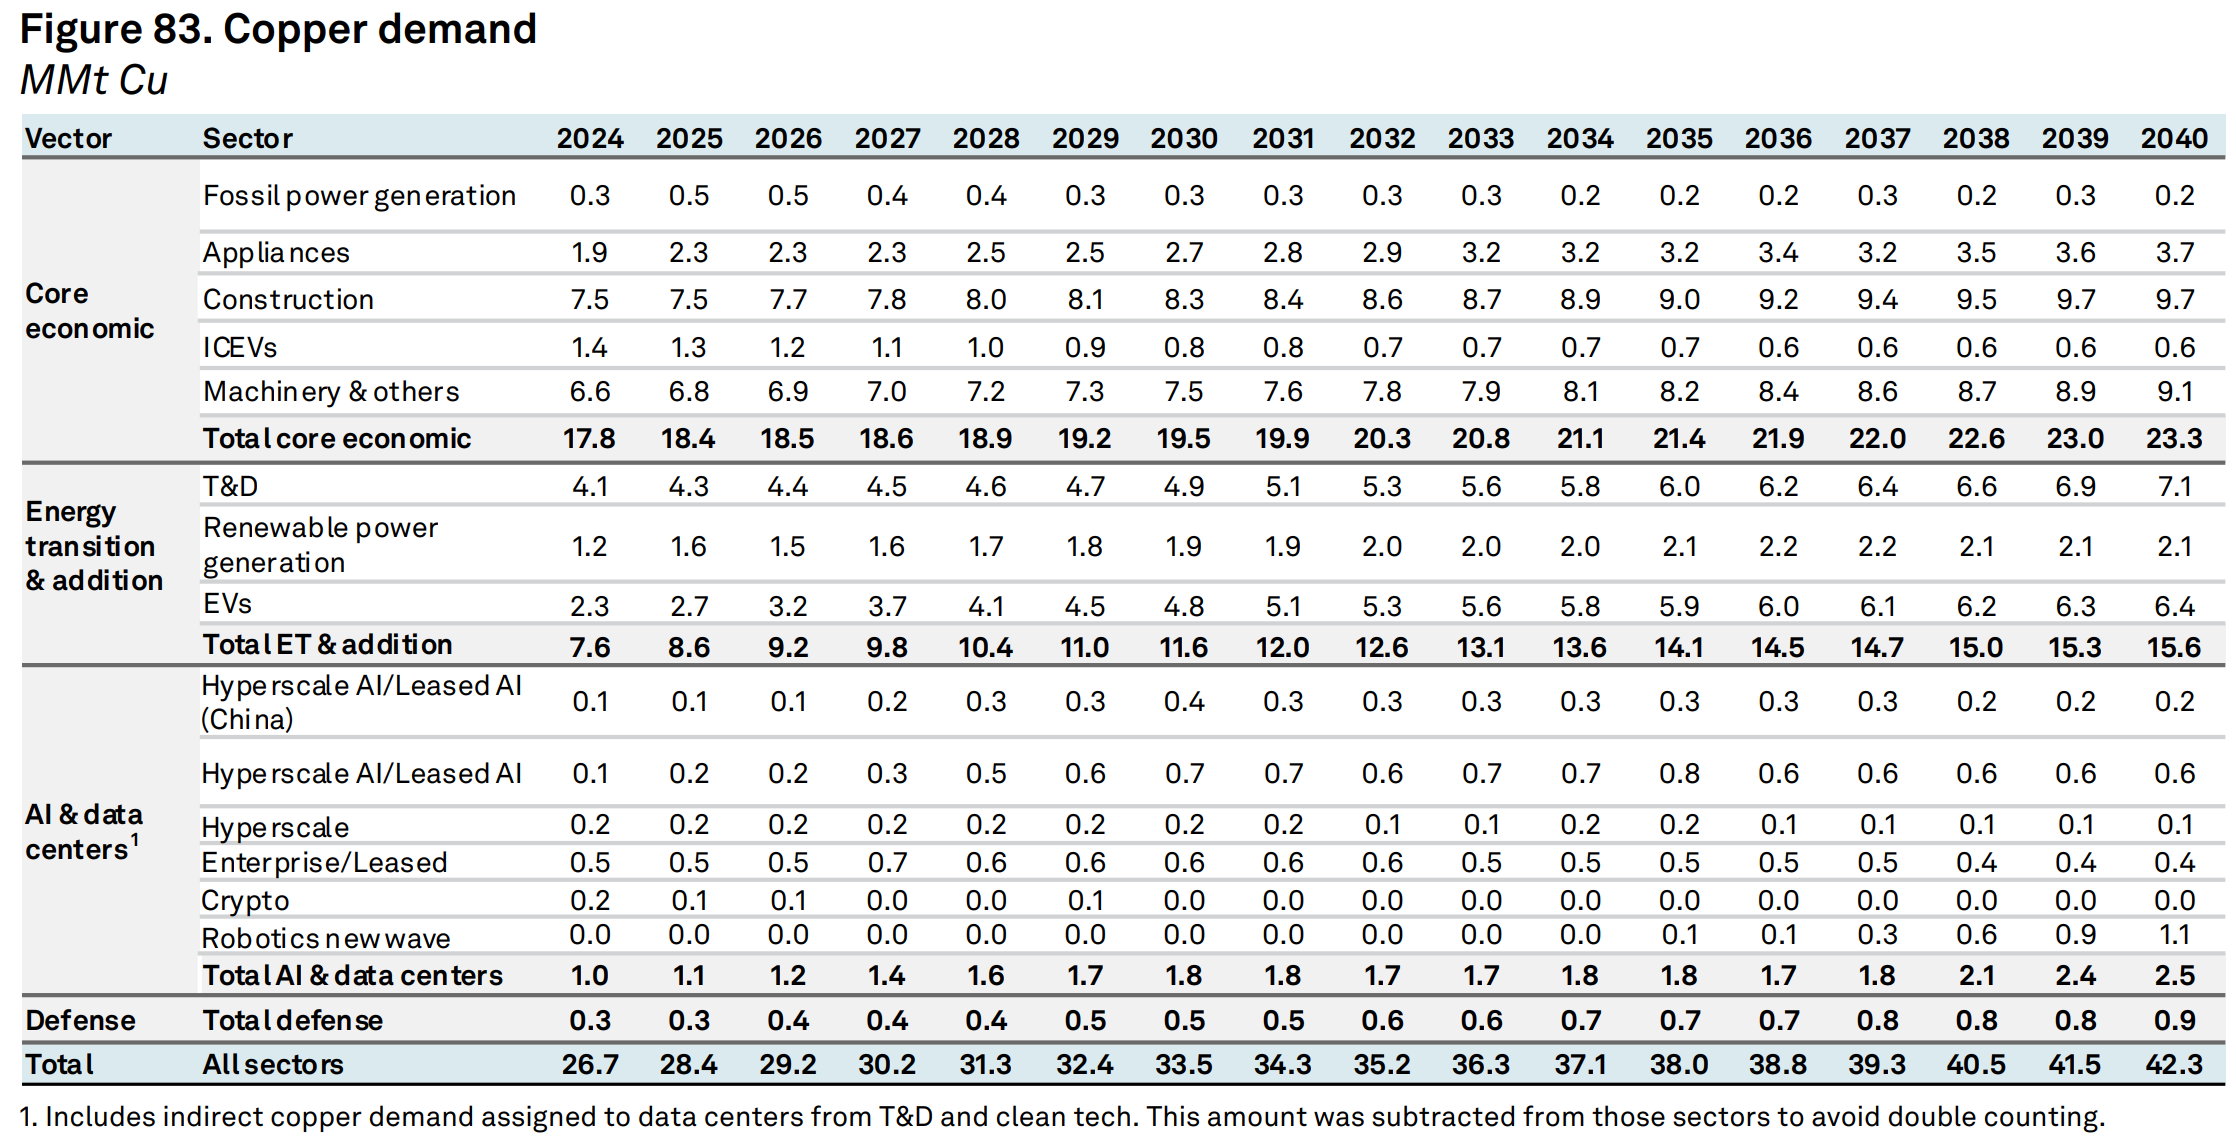
The fastest-growing uses are electric vehicles, AI data centers, defense stockpiles, and grid renewal in Europe and the United States. Estimated annual demand in 2026–2028:
- EVs: 3.2–4.1 Mt
- AI data centers: 1.2–1.6 Mt
- Defense stockpiles: 0.4 Mt
- Grids: 0.75–0.80 Mt in Europe and 0.45–0.55 Mt in the US, or about 1.3 Mt combined. This is not reflected in the T&D line in the table above.
Copper learning notes
These notes emphasize facts and conclusions to reduce cognitive load.
- Copper conducts electricity and heat well and is corrosion-resistant and ductile. Silver conducts better but costs more than 200 times as much.
- Aluminum conducts less well but can replace copper in some uses. Strong substitution incentives historically appeared above a copper/aluminum price ratio of 3; recently the threshold has moved toward 3.5 as urbanization, renewables, and data centers change requirements.
- More than 60% of copper exists as wire, showing the importance of electricity transmission.
- Economic development and electrification are closely related. Per-capita electricity use in Nigeria may be below 2% of that in the US. About 730 million people lacked electricity in 2024.
- Per-capita electricity use in developed countries such as the US and Japan peaked around 2007 and has been flat to slightly lower, possibly because industry moved to developing countries.
- China has been the largest copper consumer for decades. Mining is distributed across South America, Africa, and elsewhere, while mid- and downstream processing is concentrated in China. Stagnant Chinese property and infrastructure would weigh on demand.
- Copper demand grew about 2% annually over the past 30 years and about 4% over 75 years. Recessions and monetary tightening have historically reduced demand and price. EVs, grids, and data centers are the main incremental sources today.
- In 2025, global refined copper demand was 27–28 Mt, supplied by more than 23 Mt of mined copper and over 4 Mt of recycled copper.
- Copper can be recycled. Higher prices necessarily encourage scrap recovery and restrain price.
- Copper exists in common rock, but a tonne of local rock may yield less than one kilogram—economically useless.
- Thirty years ago, a 1–2% grade was considered good; today 0.5% can qualify.
- Humans have used copper for millennia and explored much of the earth. Multiple new high-grade discoveries are unlikely.
- Only 14 deposits totaling about 46 Mt were discovered in 2014–2023, versus about 225 deposits and 1.27 billion tonnes in 1990–2013. Expanding supply is difficult.
- Falling grades mean moving more rock, digging deeper, and operating in remote areas—all of which require capital and raise costs.
- A small mine can require at least US$1 billion; a large one often needs US$5–10 billion. Capital is locked up for years amid political and operating risks.
- Scale, technology, and valuable by-products have kept C1 costs from rising in line with falling grades, partly hiding the higher capital barrier.
- Technology could make lower-grade ore economic or expand recycling, raising supply.
- The copper price needed to trigger new projects depends on government take and interest rates. Projects generally require an IRR above 15%, including funding costs during lengthy approval and construction periods.
- The top 12 miners produce half of mined copper. Some modern mining companies have survived for centuries; imprudent operators have already disappeared.
- Competition among miners is intense but less visible, occurring through M&A, resource access, and political relationships.
- Miners currently prefer acquisitions and brownfield development to greenfield exploration. Capital seeks certainty, while mine development contains many uncertainties—government often being the largest.
- Brownfields take roughly 3–7 years to generate cash; greenfields often take 10–20. Arizona’s Resolution deposit grades 1.5%, was found in 1995, taken over in 2004, and entered permitting in 2013; litigation continues and mining has not begun.
- Chinese miners generally accept more risk than Western peers and invest more readily in politically unstable regions such as parts of Africa.
- Governments can appropriate mining economics because subsoil resources belong to the state. Many miners now face effective tax burdens around 30–50%, with the burden rising.
- Supply surprises are mostly negative—accidents and geopolitical disruptions. One of the few positive surprises is finding more economic ore around existing mines.
- Western capital markets favored asset-light internet and technology companies for two decades. Since the AI boom, those companies have redirected large cash flows into hard assets.
- Defense uses relatively little copper against the enormous base, but copper is indispensable. It is therefore exposed to both defining variables of the era: AI and geopolitics.